Definition:
parametrized
Drill through is just an operation in cognos through this we can send control from one report to another report. It may be static or dynamic. Static means the report on which you apply drill through cannot effected in case of data to the destination report. and in dynamic drill through the data that you select from source report may impact on destination report by apply the filter in destination report :
In Active Reports:
The concept in same just like in list, chart or crosstab report but there is some changing in browser filters. When viewing an active report that contains drill-through links in Microsoft Internet Explorer 8 and later, the links do not work.
Steps:
1. Open the active report.
2. Drag button bar in to the work area and set the labels of buttons by click on button definitions icon .

3. Drag Deck from tool box into the work area and set their label as same as button bar labels through deck card definition.
4. Drag list report into the deck 1.
5. Drag chart report into deck 2.
6. Also drag data items in to the relevant report objects.
7. Apply drill through on list column by right click on it and select Drill through Definition.
8. Select the target report. And fill the below wizard according to your requirement.
And click OK.
9. Now set the relational behavior between button bar and Deck. By clicking on inter active behavior button icon
 of button bar.
10. Click on create a new connection.
11. Check your source and destination objects from the above drop down bar. And click Connect then OK.
12. Run the report.
13. When you click on drill through values in list report then error occurs
14. The search path "<drill_through_target_search_path>" is invalid.
15. Details
16. CM-REQ-4069 The property "na" is unknown. Replace it with a valid property
17. To resolve the problem, make the following changes to the security settings in Internet Explorer.
18. Open internet explorer.
19. Click on tool from menu bar and select ‘internet options‘.
20. Click on security tab and then click on custom level.
21. From the settings set the Enable XSS filter Disable. The click OK twice.
Animation Effect In Active Reports:
1. Suppose you have report as same as above and you want to animate our report objects like list, chart and crosstab then.
2. Click on deck that you are using if you are using data deck the click on data deck.
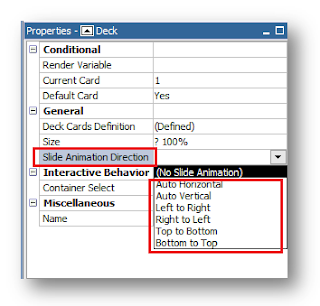
3. From the properties panel select the property of slide animation Direction and set your animation direction. Having following options.

4. Run the report.
5. This will give you a animation effect on that objects that you are using in your DECK or DATA DECK
For Further visit: http://www.segmentbi.com/
No comments:
Post a Comment